Background
Parexel International is a life sciences consulting firm. It is one of the largest clinical research organizations in the world with around 15000 employees.
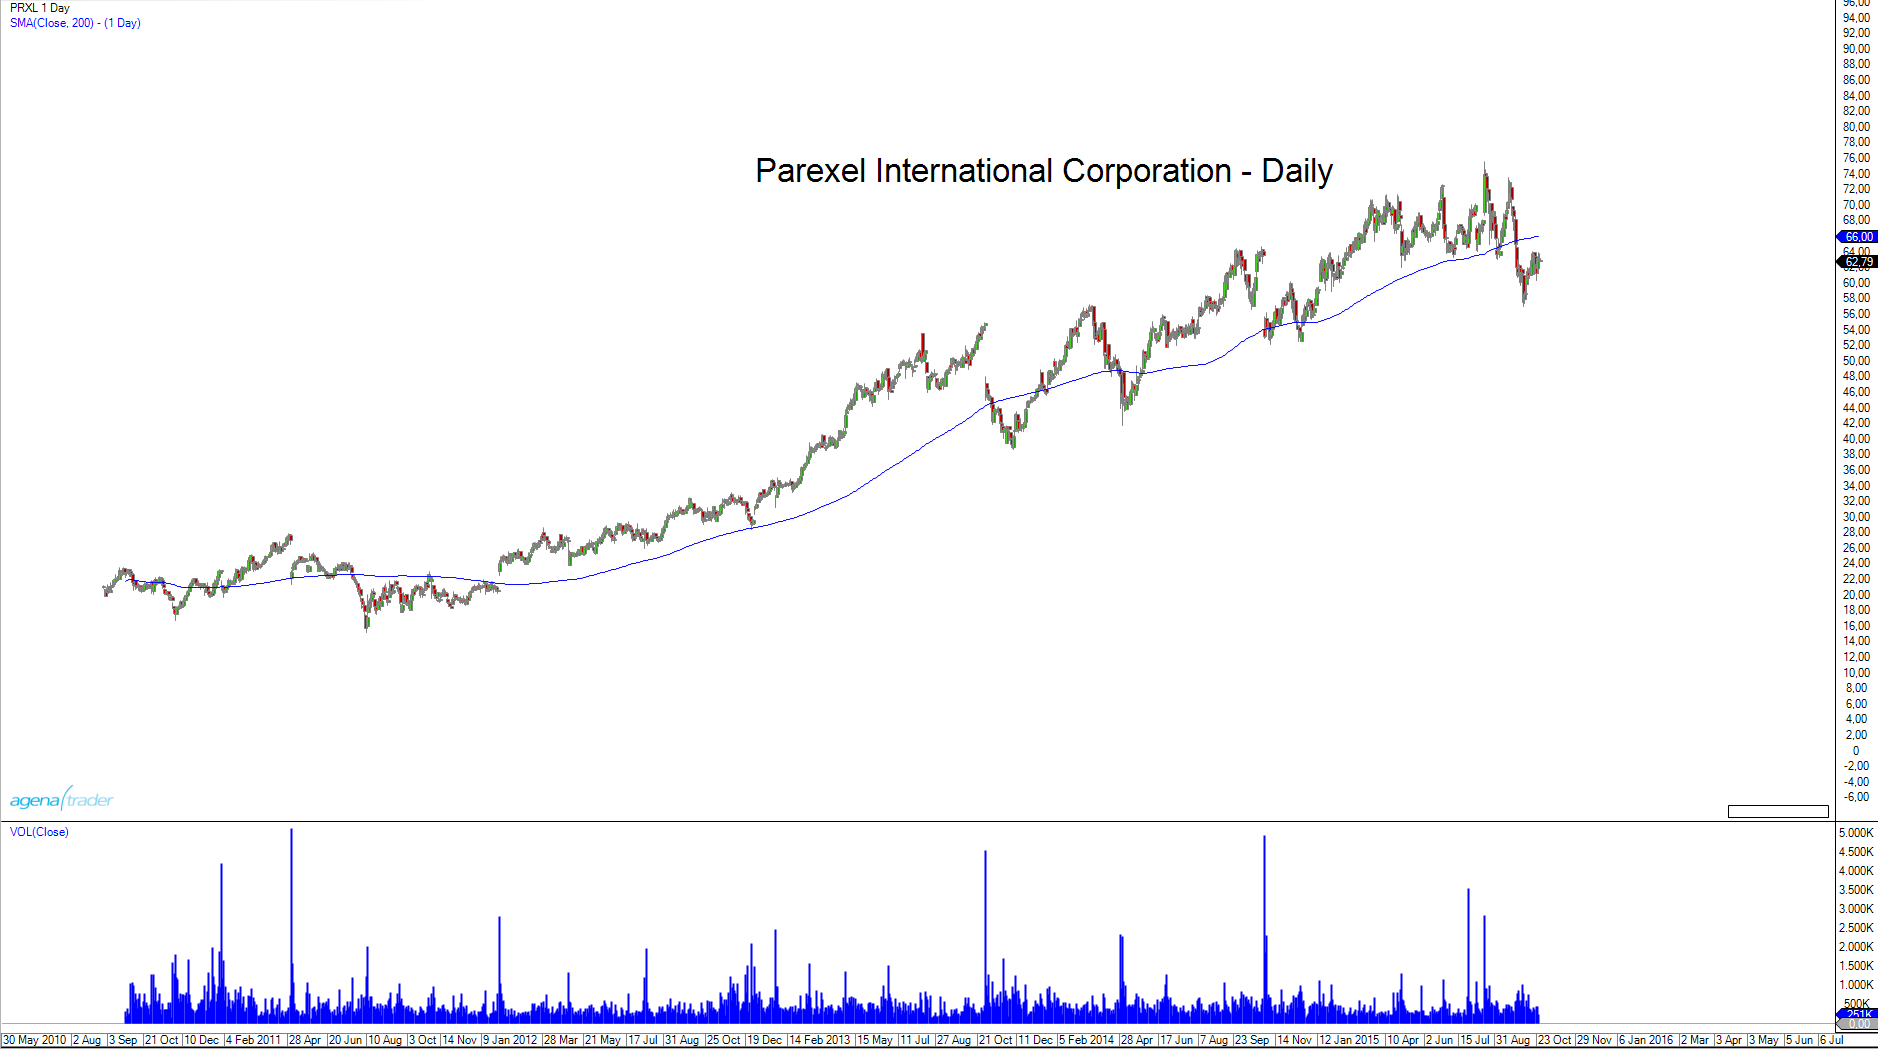
The stock made an uptrend over the last years, without breaking the SMA 200 significantly (figure 1, blue line) until a few weeks ago. Parexel formed it´s all-time high in August at $75.55. Since then, the stock developed a strong downtrend (figure 2, blue lines). At the moment the stock is in a correction.
Management and risk description
Because of the actual strong downtrend we should look for a short trade. PRXL is at the beginning of establishing a bigger downtrend which gives us lucrative targets in short direction. Especially if the overall market shows signs of weakness. The stock has broken the SMA200 significantly, which might give us additional momentum. We could enter a short trade at the red arrow (figure 2) if we get a signal on the subordinate trend which might look like the black arrows on figure 2. Even if the first target is not that far away from our entry the second and third target are quite lucrative at $57, $53 and $42.
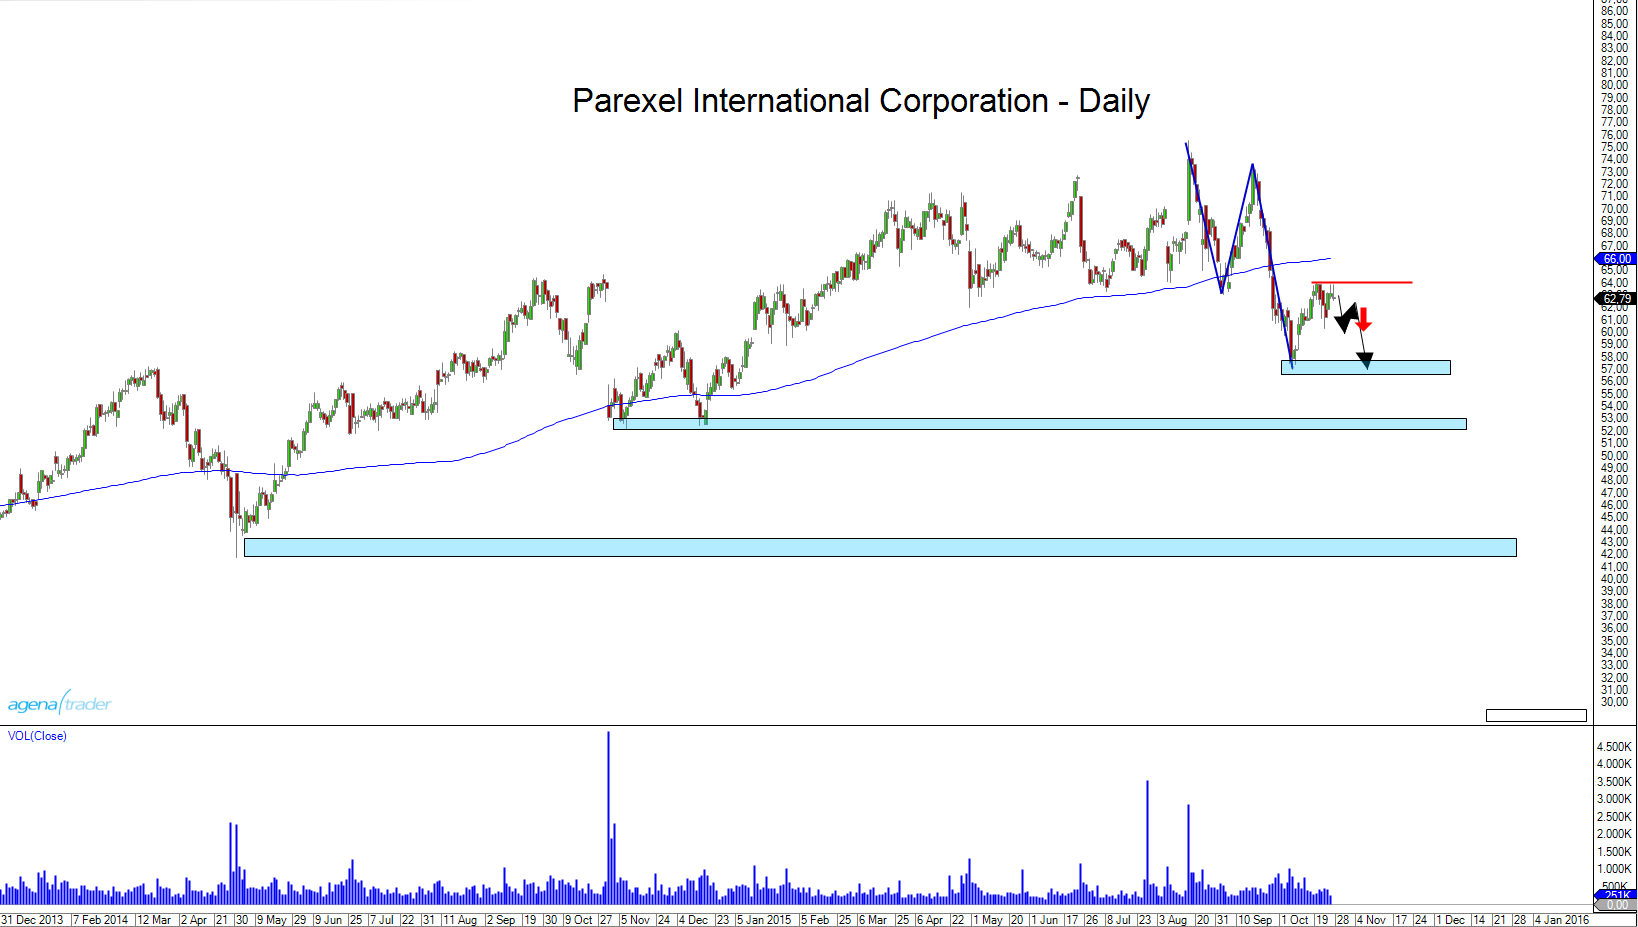
If the stock rises over $64.20 our short idea would be over for the moment, because we would be in a small uptrend then. But the bigger down trend is still alright and we could enter a short trend later when the stock develops a new subordinate downtrend.
Parameters
Entry: $60,00
Stop: $62,50
Targets: $57,00, $53,00, $42,00
Time horizon: medium-term
Disclaimer:
Disclosure according to § 34b WpHG due to potential conflicts of interest:
The author is not invested in the relevant securities or underlying securities at the time of publication of this analysis