Background und Analysis
Amgen is an US-American biopharmaceutical company headquartered in California. Amgen has 18000 employees and is the world’s largest independent biotechnology firm. The stock is listed on the NASDAQ.
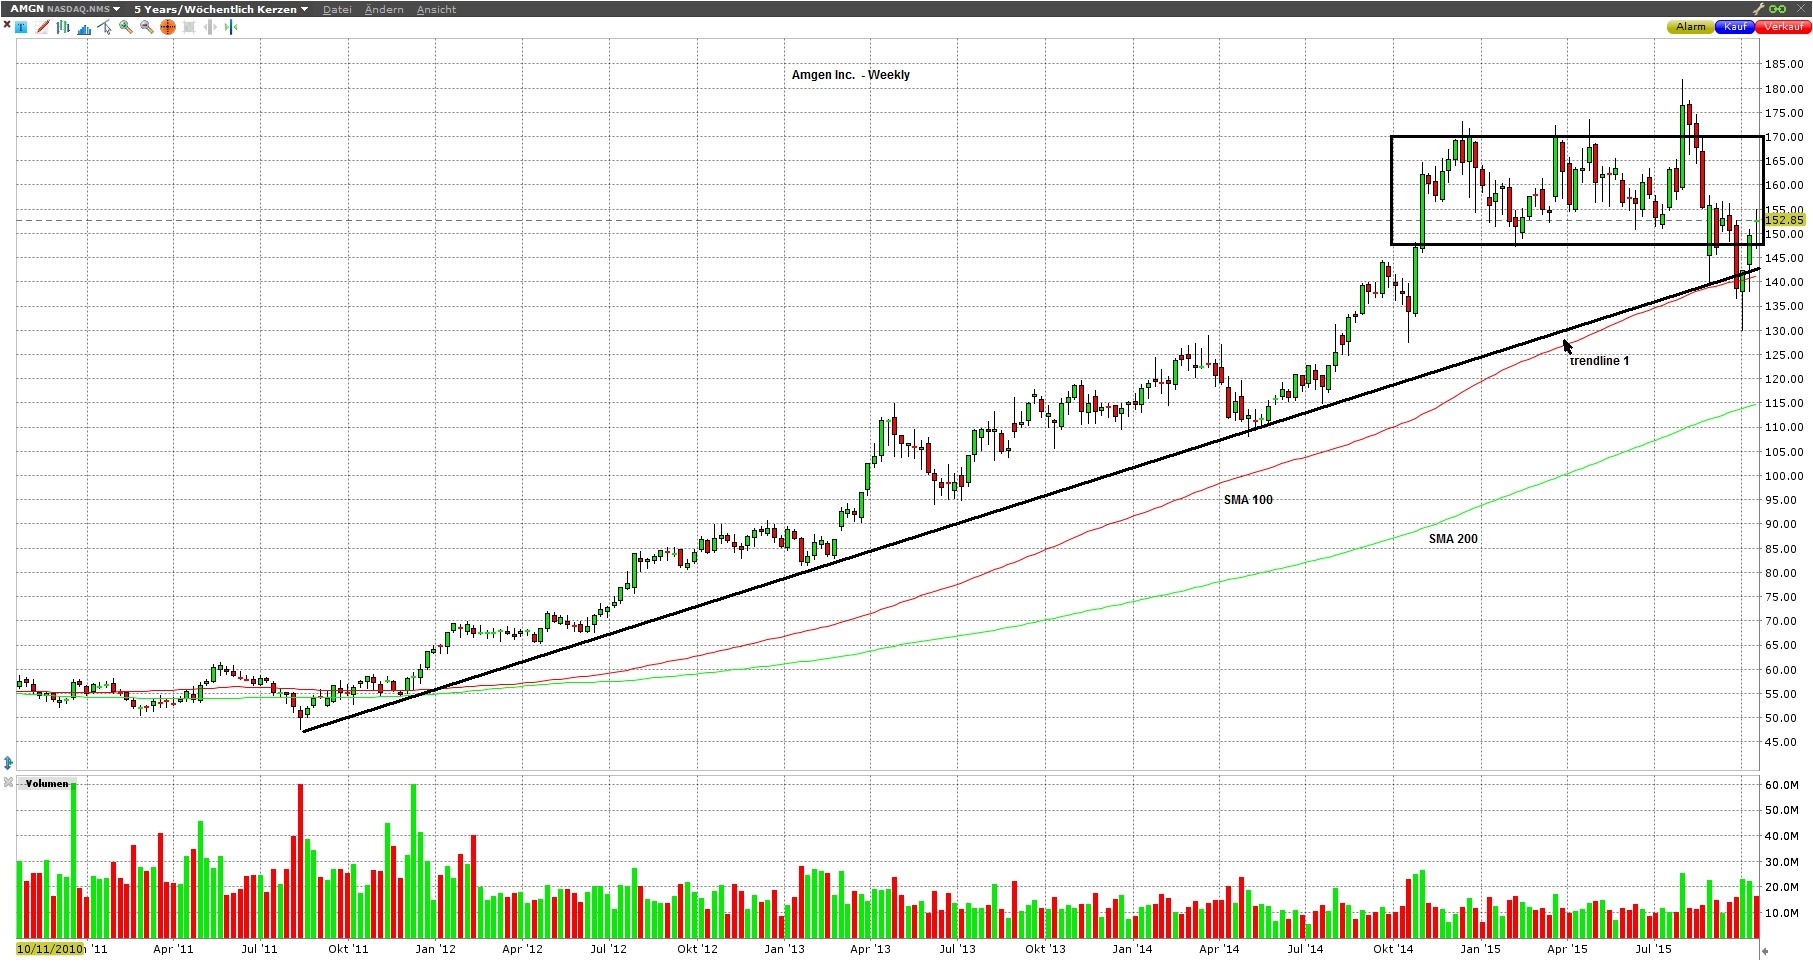
In Figure 1 we can see that the stock has risen from $50.00 in 2011 to around $180.00. Amgen established a clear uptrend, which gained strength in the end of 2014. In 2015 AMGN developed a sideways range between $150.00 and $170.00 which is highlighted as a black rectangle in Figure 1. AMGN left this zone and formed a correction after breaking the SMA 100 and the trend line 1 downwards. If the stock also breaks through the $140.00 it should fall even faster. For mid-term traders there is a local downtrend on the daily chart at the moment which might correct until $155.00.
Trading
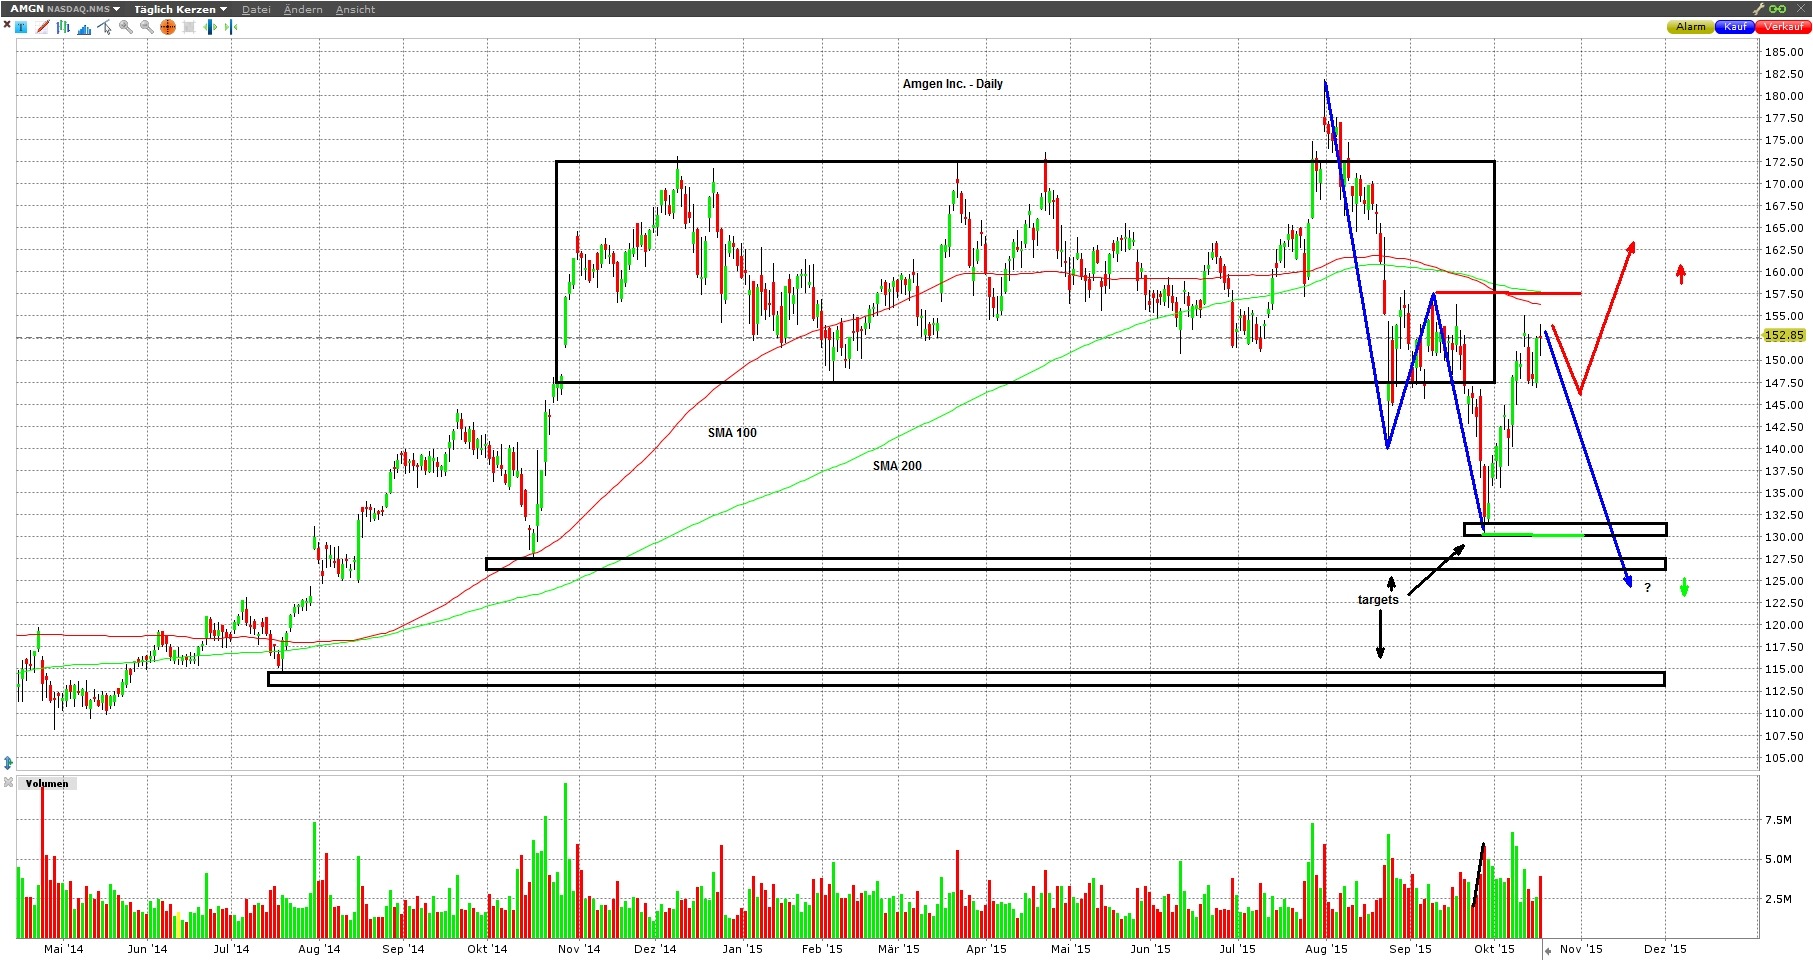
On the daily chart (Figure 2) the strong downward trend is clearly visible (blue lines), which has left the sideways range (black rectangle). The strength is recognizable by the fast downward-moves since the all-time high, while the corrections take several days. The volume in the actual correction is unsteady.
At the moment the stock has formed a 90% correction with low volume at the moment and is near the SMA 100 and the SMA 200 which should form a strong resistance zone. For a defensive, mid-term short trade we could wait for a subordinate trend for an entry. A more aggressive option would be to trade the blue daily trend.
If the down-trend accelerates, there are lucrative targets at $132.50, $127.50 and $115.00. If AMGN breaks through $158.00 our short-trading idea is over. Before any trade it is always necessary to look for news e.g. company earnings.
Parameters
Entry: $155.00
Stop: $158.50
Targets: $132.50 , $127.50 and $115.00
Time horizon: medium-term