Timeframe: short-, mid-term
Overview:
Zions Bancorp. is a US corporation that operates in the banking business. The activities of the financial group includes the traditional banking services for private and corporate clients e.g. loans for companies, real estate morgages and investment products.
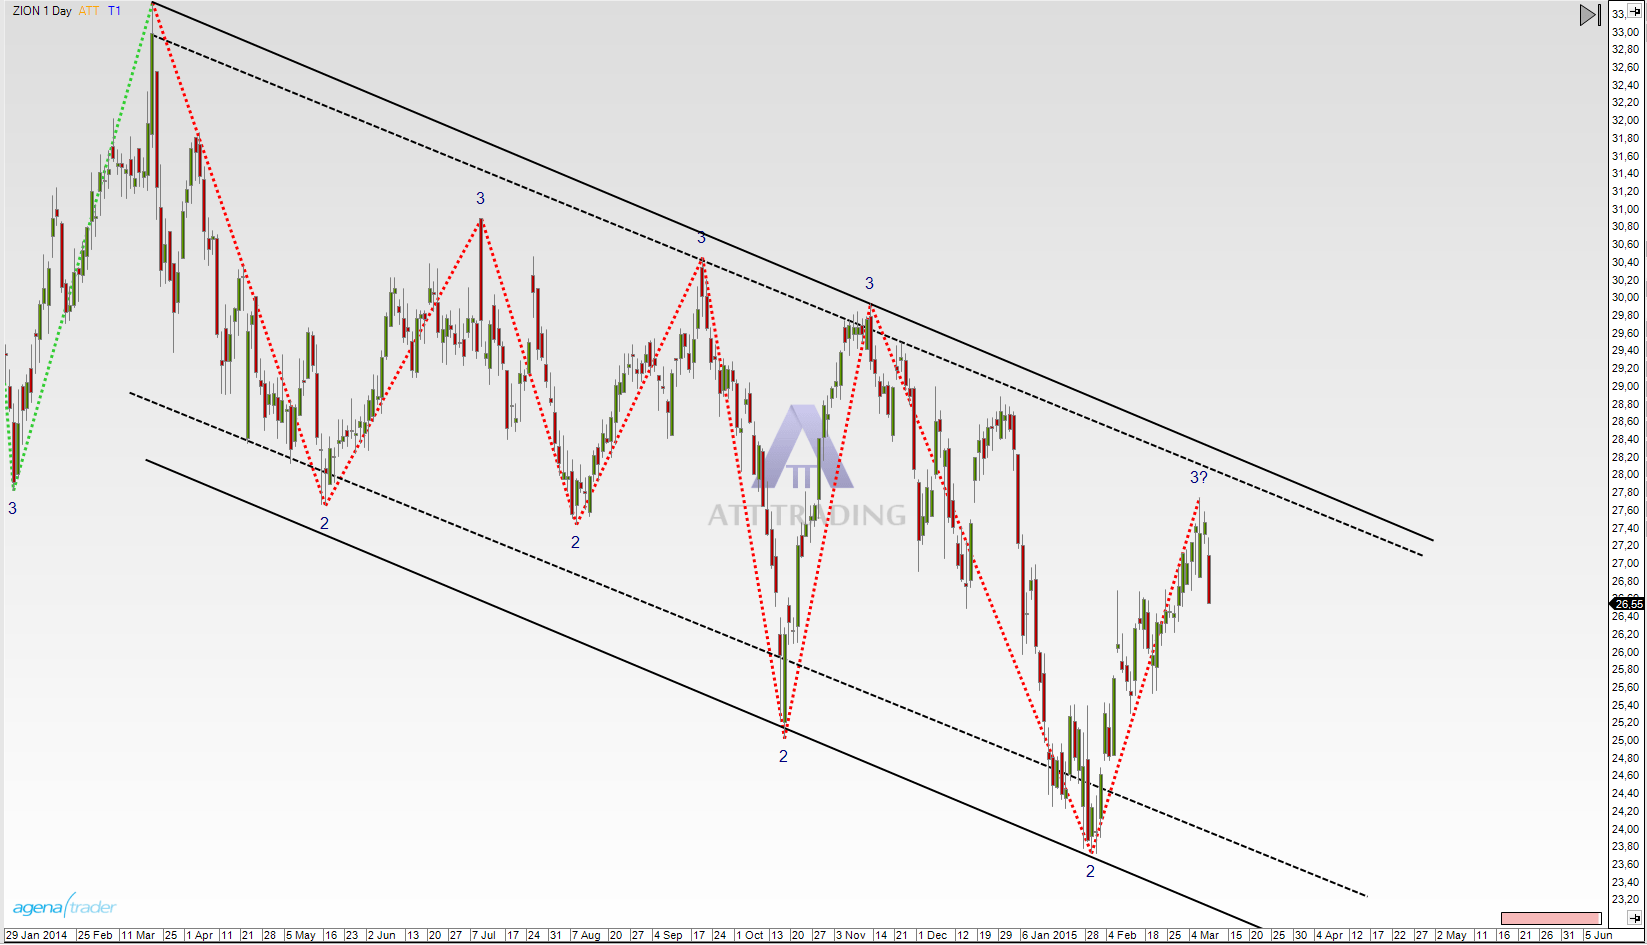
Since march 2014 the daily chart shows us a long-term downtrend which takes place in a trend channel.
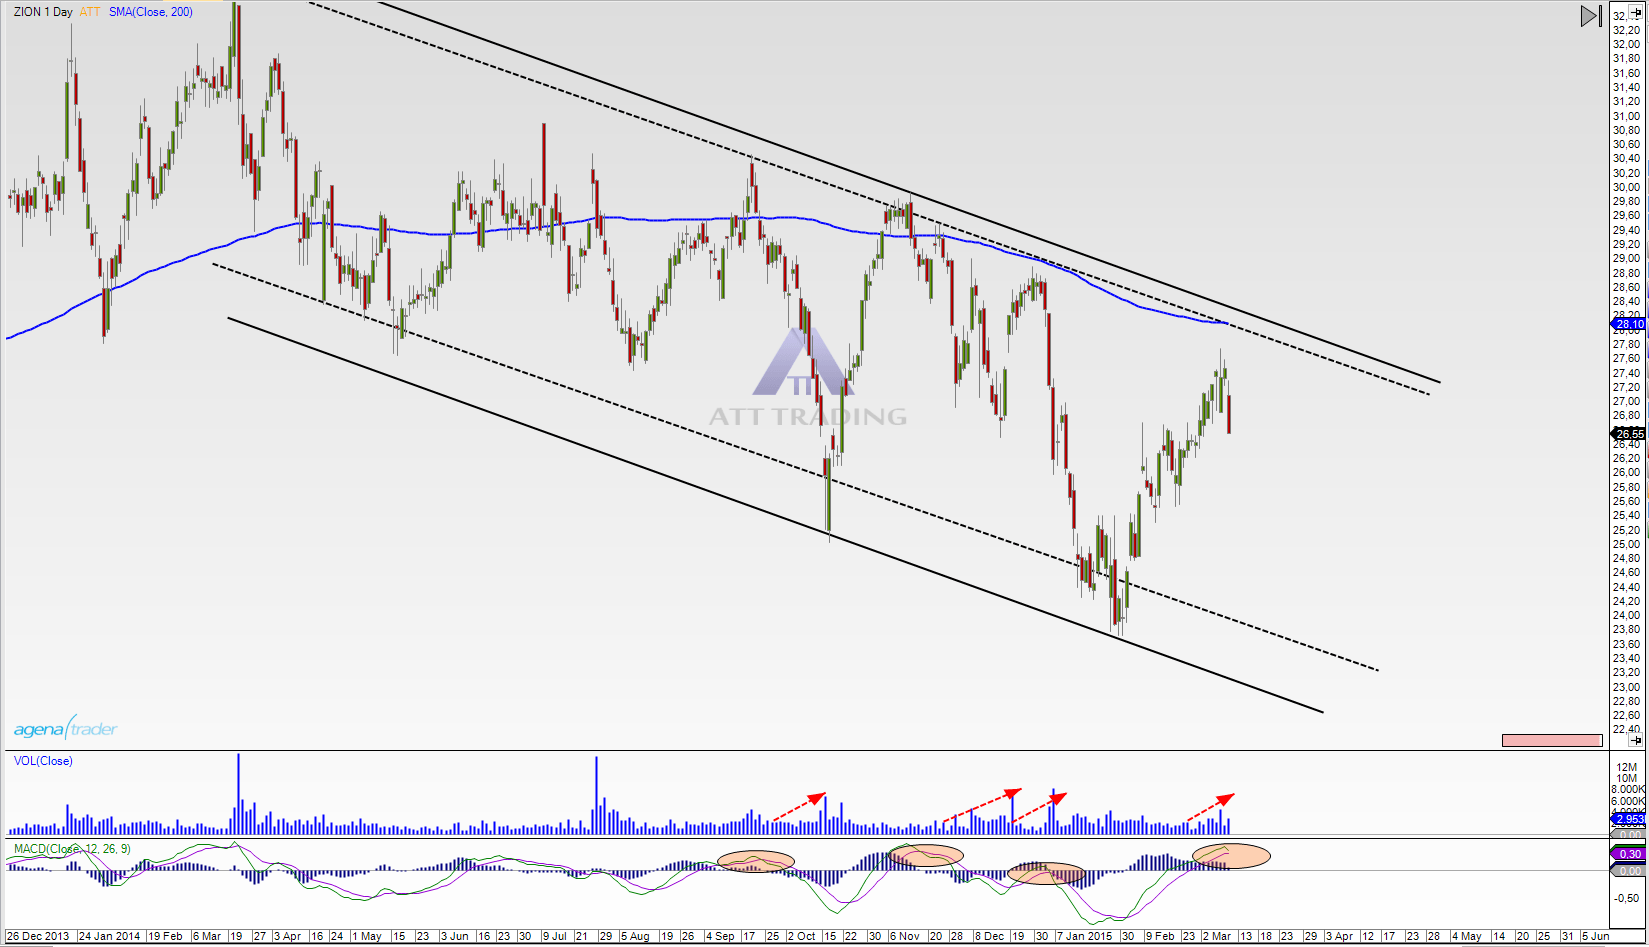
In picture b we can also see some more points that support the short scenario:
1. The price is under the 200 SMA.
2. The volume is higher when the price goes down.
3. MACD is oversold.
Scenario 1, picture c:
In picture c we see a massive resistance zone, which includes the trend channel, the 200 SMA, the red trend line and the last highs around the area at $28,70 and $29,00.
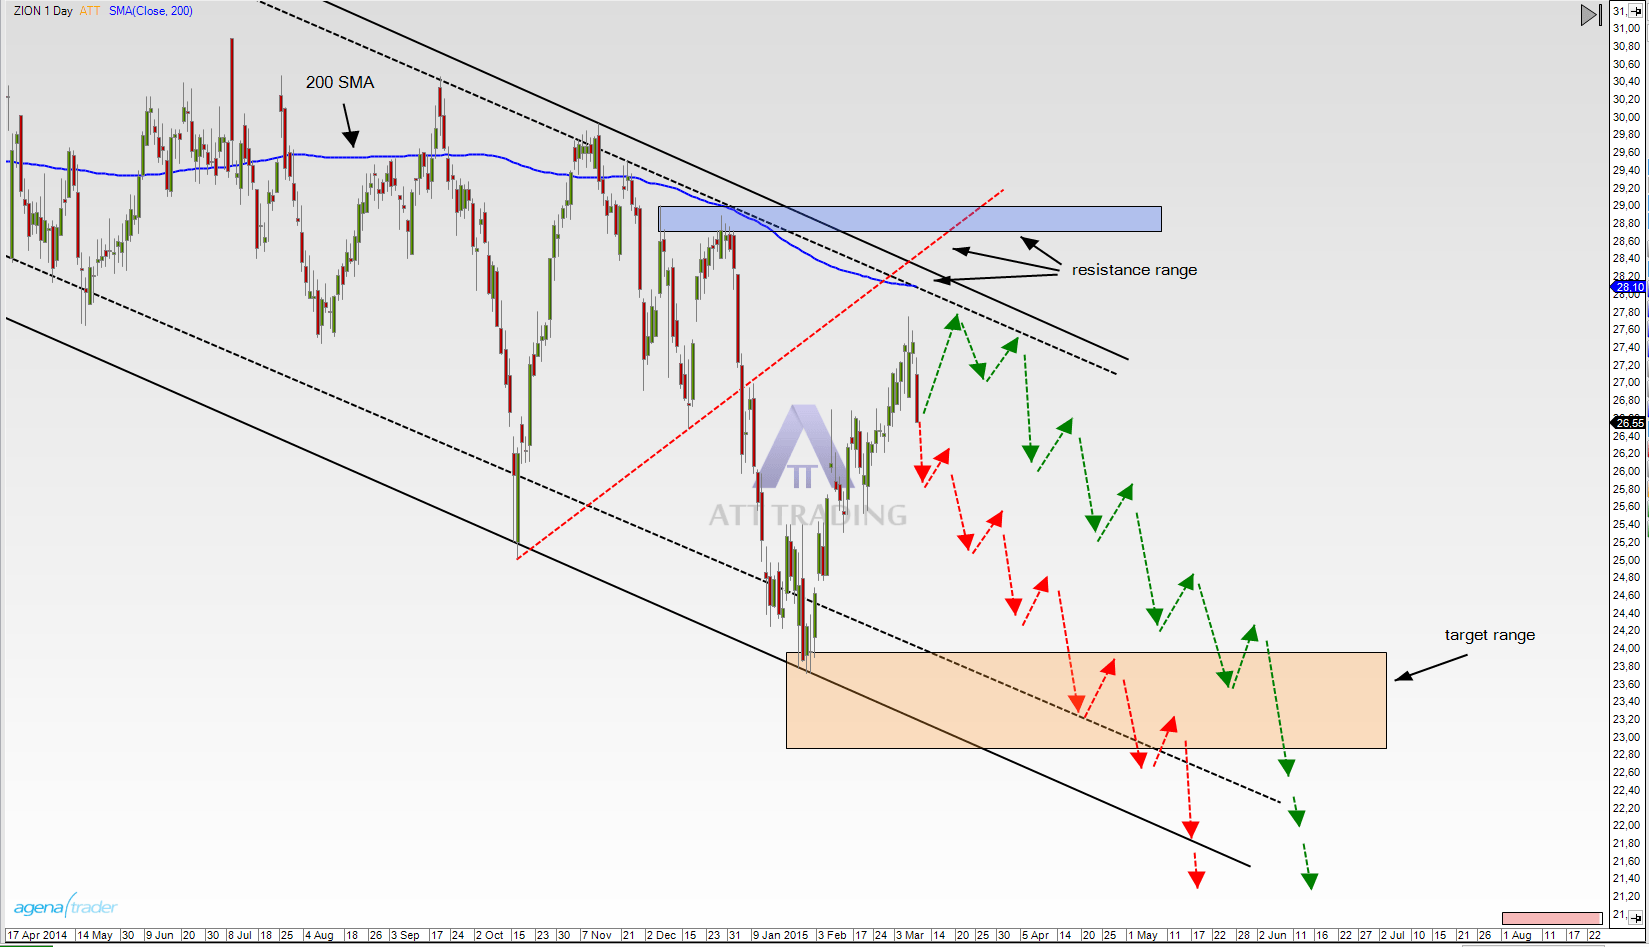
The arrows show the possible processes of the stock. The main target is between $23,00 and $24,00. In this area we can see a strong support zone. Here the price could turn again to continue it´s run inside the trend channel or the stock could also break through this zone. Accordingly, a trader should be prepared for both situations.
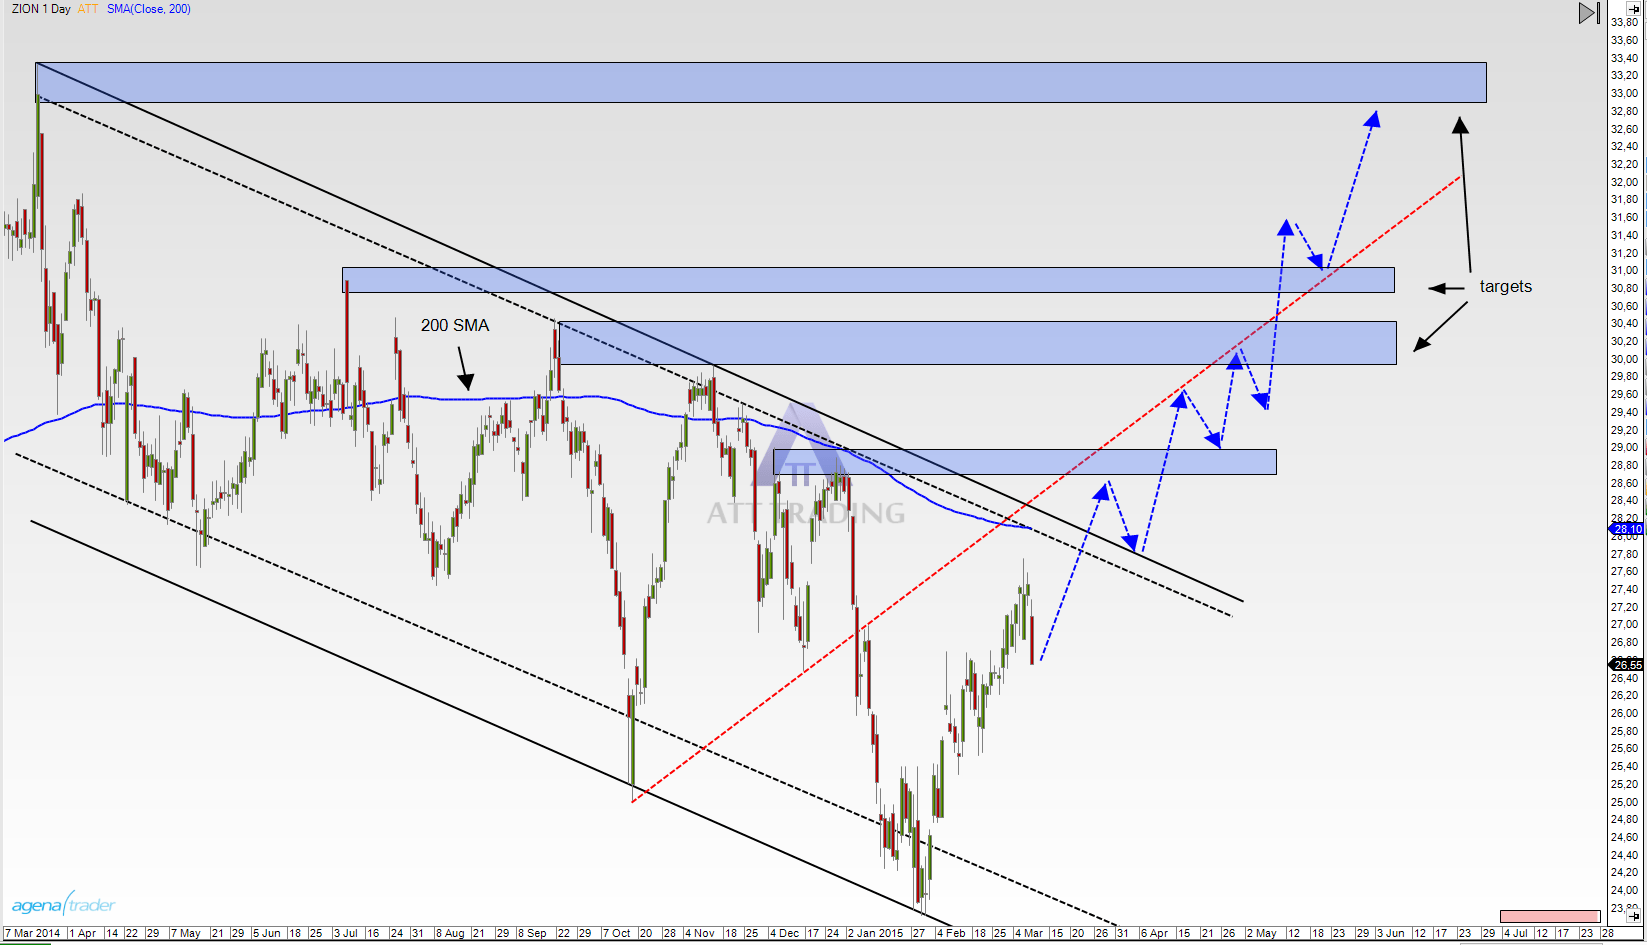
Scenario 2, picture d:
Alternatively, the stock can also be traded long when it would leave the trend channel upward. Then the previous resistance zone would act as a support zone and we would also have some very attractive targets.
The picture d shows the possible direction of the stock.
Conclusion:
As long as the price does not leave the trend channel upward, the stock is a clear short candidate. The indicators we dicussed support this short scenario.
The trader should also pay attention to corporate reports and other news that may impact the stock price.
Disclaimer: Disclosure according to § 34b WpHG due to potential conflicts of interest:
The author is invested in the relevant securities or underlying securities at the time of publication of this Analysis