Background und Analysis
Williams Companies Inc. (WMB) is an US-based energy company. It´s core business is transportation and processing of natural gas. The stock of WMB is a component of the S&P500 and the Dow Jones Utility Average.
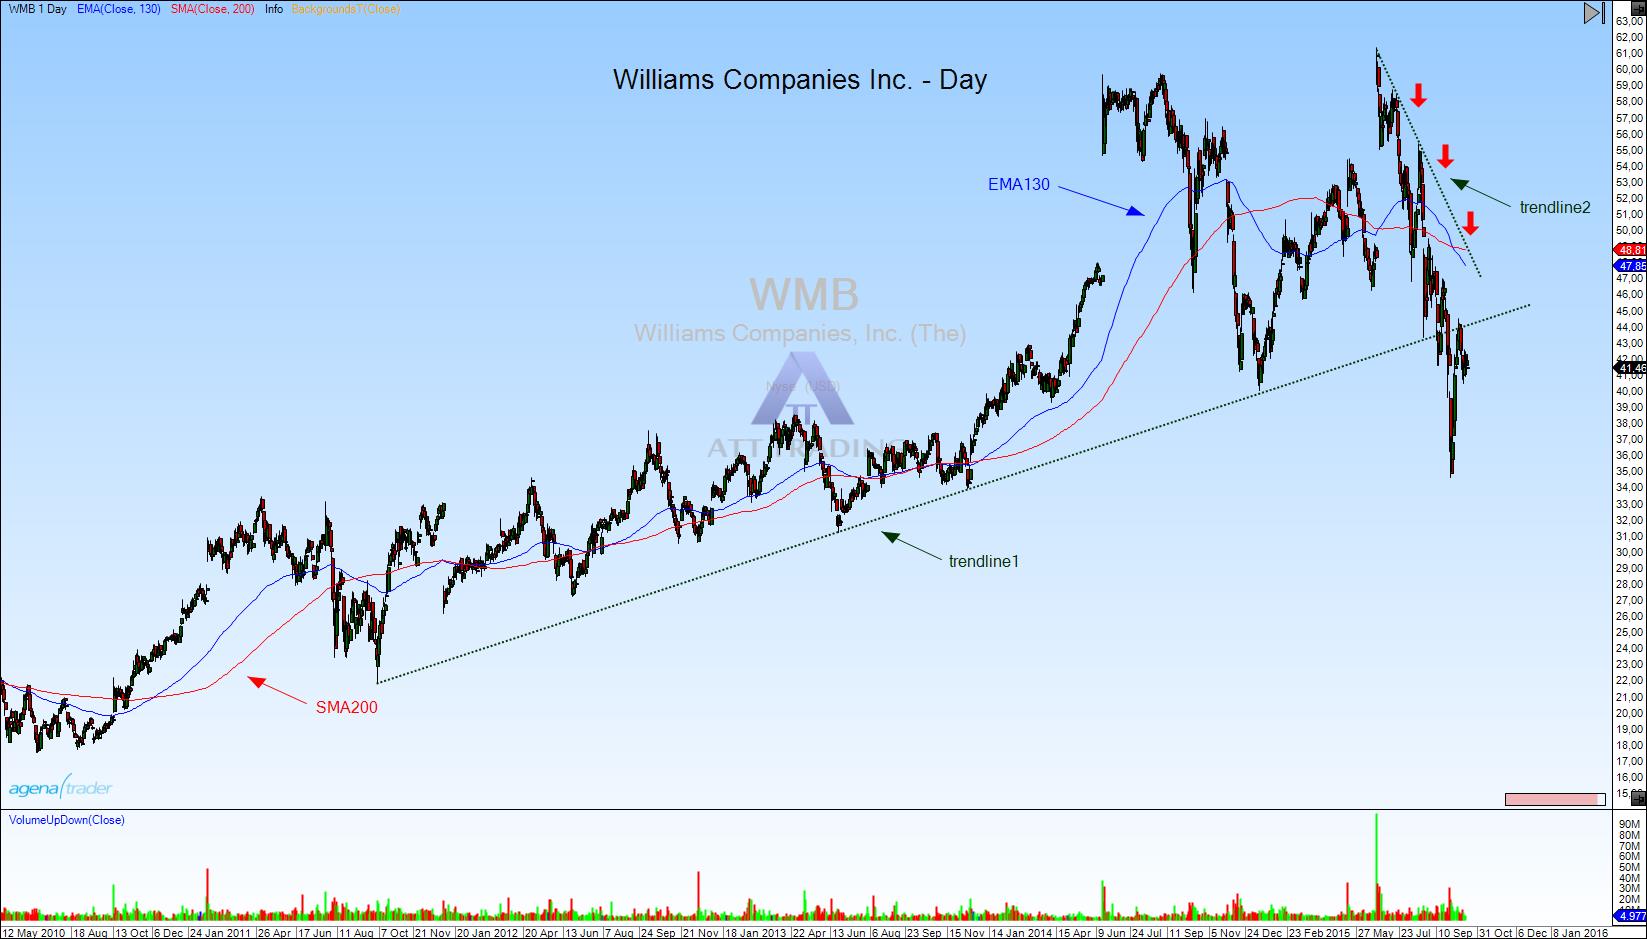
WMB is in an uptrend (figure 1, green trendline1, SMA200 and EMA 130) which has risen from $17.53 in 2010 to $61.38 in June, 2015. Since the end of June WMB is in a strong correction, which formed an downtrend (figure 1, green trendline2, red arrows). This might give us the chance for a short-trade.
Trading
WMB formed a correction of 70% since end of september (figure 2). This gives us lucrative targets around $35 and $31 (figure 2, green targets) in short direction. You might look for a short entry in a subordinate trend. In figure 2 you can see a resistance zone (red rectangle), which also confirms our short-idea.
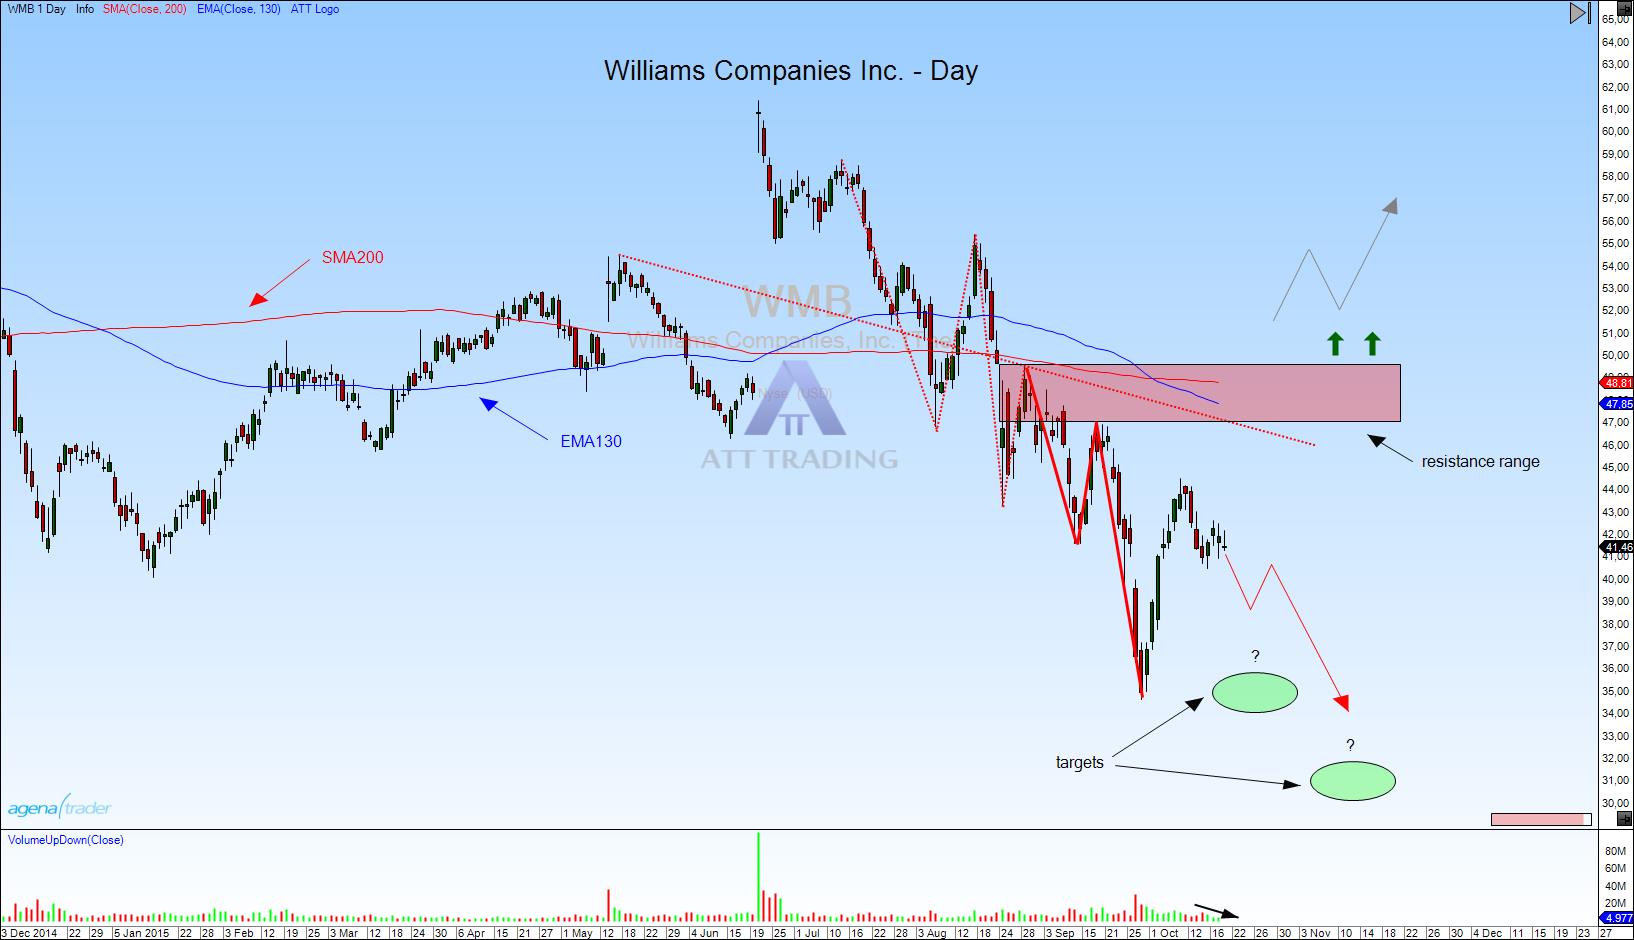
This resistance zone consists of the SMA200 and the EMA130 which form a big resistance together with the red trend line. The short trend is not broken as long as the stock price does not break through this zone. If WMB breaks $47.08 significantly our short idea is over. Before any trade it is always necessary to look for news e.g. company earnings.
Parameters:
Entry: around 40$ to 44$.
Stop: around 45$ to 47$.
Targets: 35$; 31$.
Time horizon: medium-term